Portfolio Management – PivotPoint Style
Tender Loving Care for Your Life Savings
<!–more–>
Here at PivotPoint Advisors, we manage a range of well-diversified, asset class-based portfolios—updated every quarter—that we think capture the ever rolling waves of the market. The range includes portfolios for the most conservative or most aggressive investor as well as the majority of us who are somewhere in the middle. We match the portfolio to the client’s situation, which is why we like to get a bit of financial information from a client’s life. For the financially-savvy reader—we manage a total of 10 “core” portfolios, created from the best asset class ETFs, that all lie on the efficient frontier possible with the securities. The frontier is updated quarterly.
Geez, what do those last two sentences mean?? If you complete reading this article, you might just be able to come back and understand!! Let’s break down all the buzzwords and most importantly get to the “why” of things not just the “how”.
What are Asset Classes, and Why Are They Important?
The financial markets categorize securities (meaning stocks, bonds, mutual funds, ETFs) in useful ways. The main asset classes from an American perspective are large public company stocks (Apple), medium-sized companies (First Solar), and smaller companies (Crocs). Stocks can be further divided into “growth” and “value”. Apple, huge as it is still mostly considered a growth stock. Though maybe not for much longer. No company can grow to the sky.
For bonds, we generally divide them by how long it takes to pay off: short, medium, and long. We can separate them out by corporate bonds (GM, GE) or treasuries from the U.S. government. Maybe we even want to look at international bonds.
Then there are the “other” assets in the market like precious metals and real estate. These usually behave differently from stocks and bonds and that is a very good thing for building diversified portfolios.
Asset classes have been proven to be the most meaningful aspect in portfolio performance. I was blown away when I first learned that over 90% of the performance of a portfolio is determined by asset class. That means that over the long haul, it doesn’t matter much whether you’re in Apple stock, Microsoft stock, or Google stock. They’re all large growth companies and over the long haul they’re mostly interchangeable as long as they all continue to behave as “U.S. large growth” stocks. Asset classes matter most. That’s helpful. It means that low-cost Exchange Traded Funds (ETFs) can do the job for us very well, without having to do any stock picking.
What’s an ETF and Why Use Them?
ETF stands for exchange-traded funds. They are the descendants of mutual funds, and in my view beat mutual funds in just about every way. They’re traded on exchanges just like stocks, so they’re liquid. Mutual funds are generally purchased and redeemed directly with the mutual fund company. A little more complex, a little less liquid.
We definitely don’t want our portfolio to have high expenses. The companies and managers that manage fund portfolios deserve some money for their efforts. But not too much. Asset class ETFs have some of the lowest expenses available. Mutual funds, which were a great innovation in the 80’s generally have expenses that are much higher than the equivalent ETFs. The difference in returns between 0.2% ETF expense ratio (like QQQ) and 3.1% mutual fund expense ratio (like RDFI) with a $10,000 investment over 10 years is about $6,000, all else equal. That money doesn’t come out of your pocket; it was never put in your pocket and so the cost is obscured.
Each ETF represents a widely diversified portfolio in its own right. Holding QQQ, for example, gives you the total NASDAQ-100 index. You don’t need 15-20 ETFS to achieve diversification; a few will do, but it always depends on market conditions. That’s why we update portfolios quarterly. The number of ETFS in a portfolio might range from about 3 to 11 or 12. As a practical matter, we will rarely offer any portfolio with fewer than 3 ETFs. Analysis practically always produces portfolios that have stocks and bonds; at least 2 asset classes. Portfolios with 3 or fewer ETFs are either extremely conservative (PivotPoint 1) or extremely aggressive (PivotPoint 9). The middle ground is always a mixture of at least 5 ETFs.
Here are the 14 asset class ETFs currently in use at PivotPoint:
- Large Cap Growth Stocks: SCHG, QQQ
- Large Cap Value Stocks: SCHV, DGRO
- Mid Cap Stocks: IJH
- Small Cap Stocks: IWO
- Short-Mid Duration Bonds: JPST, SHY
- Mid-Long Duration Bonds: AGG, SLQD
- International Stocks: SPDW (developed countries), IEMG (emerging countries)
- Other: SCHH (Real Estate), GLTR (precious metals)
The Technical Part – What Does “Portfolio Diversification” Really Mean?
Nobody wants any more than necessary risk in their investments. Diversification, done well, can accomplish that goal.
That’s the “what”. The “how” of it is very quantitative; we program software to do this work. We want a collection of securities that behave differently, so the losses of some are offset by the gains of others. That’s all “diversification” means. If you like, just skip the next paragraph which gets into a bit of the nitty-gritty.
To optimize a group of securities, the first step is to calculate the correlations among them. If QQQ goes up by 1% and SCHV has an +85% correlation, then SCHV, on average, will go up by 0.85%. If SHY has a correlation of -30% correlation with QQQ, then on average it will go down by 0.3%. You figure out those correlations for all combinations of 2 securities. Then you do some linear programming to systematically find out how much to weight each security such that the variations of the group as a whole are as small as possible. In this context, “risk” includes moves to the upside. This methodology has a few names, but my preferred is “mean-variance analysis” or MVA. This school is about 70 years old. There is another school of thought that only downside risk should be minimized. This school is about 30 years old, it isn’t widely taught, and I personally know of no advisor that does this analysis. Except us. We do this analysis alongside MVA. We call this “downside risk analysis” or DRA. Doing this work by hand would be just about impossible. It’s a piece of cake for computers. We’re set up to do this work pretty quickly and easily.
The Client Communication Part – The PivotPoint Investments Dial
We manage portfolios on a scale of 0-10, with returns (and risk) rising with the numbers. The PivotPoint 0 portfolio isn’t exposed to the markets at all; funds are sitting in cash or short-term money markets earning a little interest like a bank account. The PivotPoint 10 portfolio is managed separately from 1-9. This is our “beat the market” portfolio, our take on a hedge fund. We use a very different process for that portfolio.
“Hi Ms. Client, your current portfolio has an expected return of 6.0% with a volatility of 7.09%. Would you like to increase or decrease the risk?” OR “Hi Ms. Client, your portfolio is set at 3 out 10 for return & risk. Would you like to dial the risk up or down?”
Now, we would never ask these questions in this particular way, but the example shows the power of an investing “dial” that goes from 0 to 10. This is a familiar concept—we rate things on a 10-point scale all the time. We can feel that a “9” portfolio is very aggressive. The “9” offers a client better information than talking about the portfolio having “12.42% expected return with 26.09% volatility” (which are the actual numbers for the current PivotPoint 9 portfolio).
And to make periodic rebalancing nice and inexpensive–our custodian Charles Schwab & Co. offers commission-free trades on stocks and ETFs. Clients never pay a penny when their portfolios are updated (at least quarterly).
Keeping it Flexible – What if There’s an Individual Stock I really Like? How about my 401(k)?
We’ve been looking at the “core” PivotPoint portfolios. A core portfolio can be combined with one or more “satellite” portfolios to go after more (or sometimes less) risk. Maybe your portfolio is conservative and income oriented. Maybe you have $10K with which you’re itching to “play the market”. Let’s not mess with the core portfolio—let’s create a satellite portfolio to speculate in the market. We can even run analysis to be sure the blend of core and satellite is optimized. Or not—the $10,000 can be treated as a separate pool of money. All combinations are possible because we can do the math each time with any combination of securities.
This also applies to managing 401(k) accounts for clients. 401(k) accounts very rarely offer the flexibility of security choice we see here. No matter, we do the math on whatever choices are available. Your 401(k) may have expensive mutual funds…but they’re better than hiding your money in your mattress. We’ll use whatever choices are available. We can create a separate dial of 10 portfolio possibilities for your 401(k) and then choose from those choices.
Live Examples – Here Are a Couple Current (Feb 2023) PivotPoint Managed Portfolios
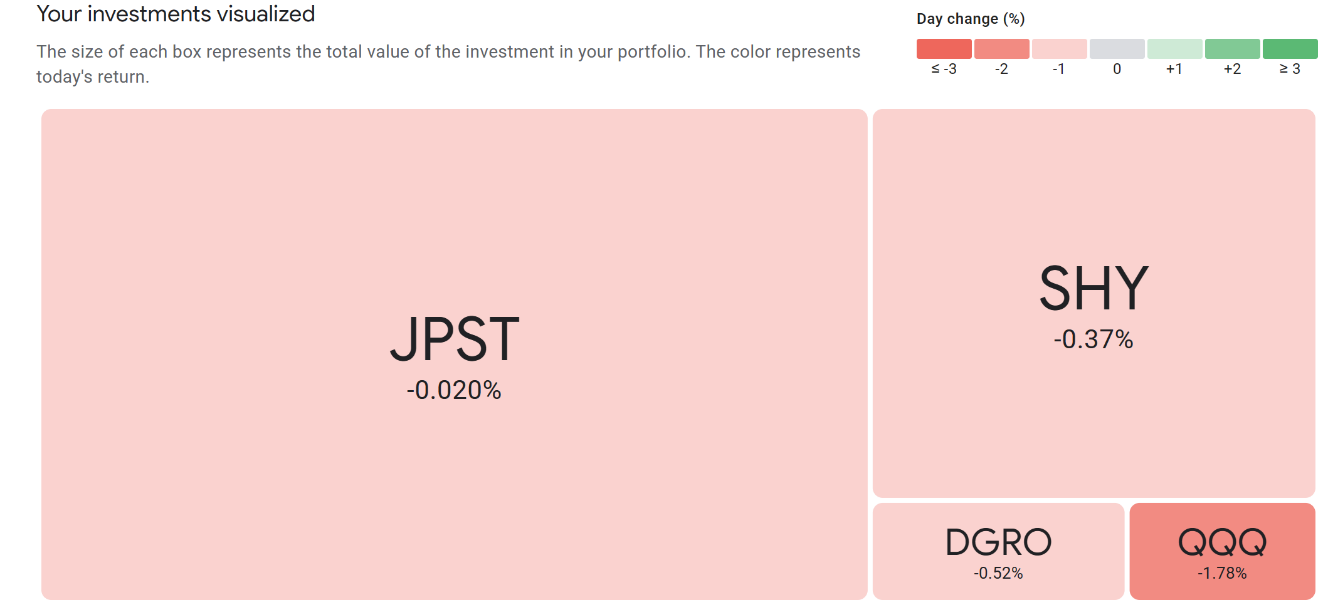
Heat maps are a great way to understand a portfolio at a glance, and here’s an example. The size of the rectangles shows how much money is in that security and the color shows whether it’s up or down recently. This is a representation of the daily movement on February 3, 2023, of the current PivotPoint 1 portfolio:

It’s very conservative for risk, but we can see there’s some more volatile stuff in there, namely QQQ. This particular combination is optimized using some fairly intense math. It’ll be updated to new market realities on or around April 1, 2023, when we move to Q2. It’ll be different then…but not completely different. You’d easily be able to see the family resemblance between the old and new. After the quarterly optimization update, all client portfolios invested in PivotPoint 1 will be rebalanced with the push of a button (at no client cost).
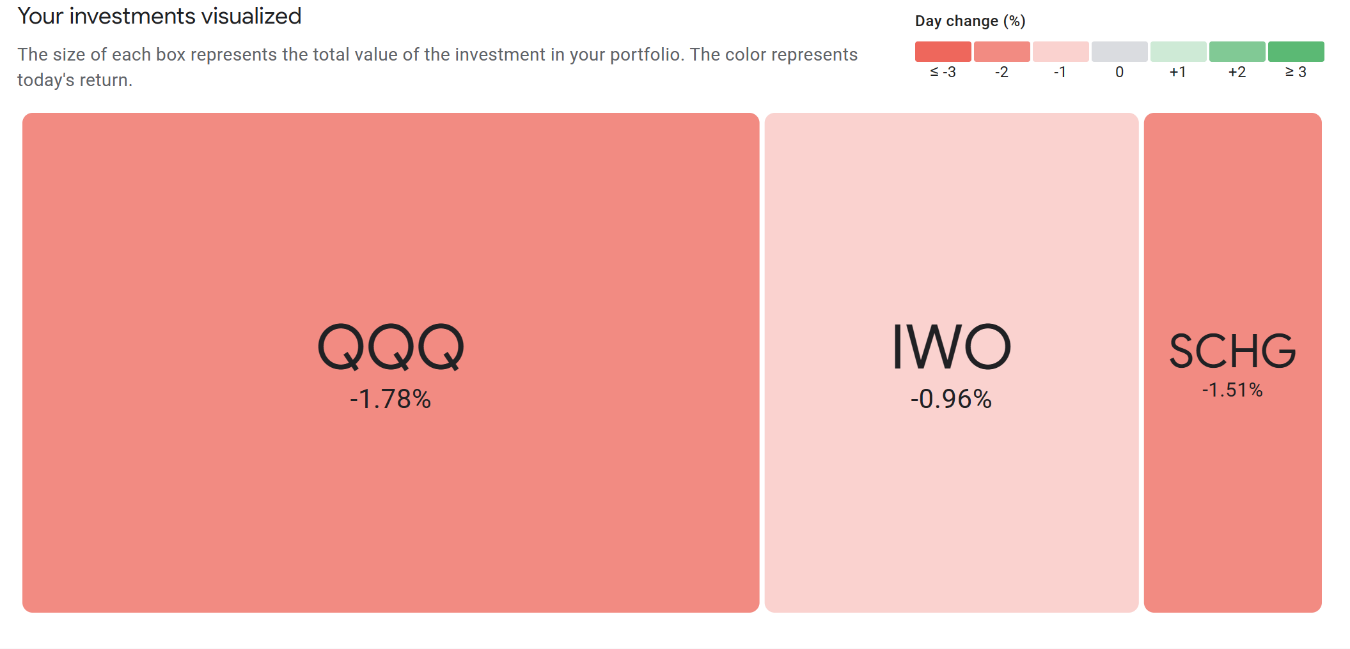
Here’s the current PivotPoint 9 portfolio: One ingredient is the same (QQQ) but it’s a completely different recipe:

Takeaways
The point of all this is to provide portfolios with superior performance. We want our clients’ portfolios to produce returns that are higher and occasional dips that are shallower. We measure and track performance for all portfolios over the short and long term. Clients get detailed quarterly updates (sometimes read and sometimes not!).
To get that superior performance, there are some qualities everyone should have in their long-term diversified portfolio:
- Low expenses
- Minimum risk (volatility) for a given return. In other words, “the math”
- Appropriate personal risk for the client—which implies the risk is analyzed/known by the advisor and understood by the client.
Our methodology accomplishes all three. I constantly imagine ways to do these three things even better, but this is the best process we’ve come up with to this point.
Feel free to share this article by locating the Facebook, Twitter, and LinkedIn buttons on the right side just below “Popular Posts” 🡪